In the journey to conquer the market, understanding the "health" of one's assets and proactively managing the portfolio are crucial for making informed decisions that enhance investment performance. However, many investors still struggle to comprehensively track their assets, understand cash flow allocation and growth over time, or benchmark their portfolio's performance against other investment channels.

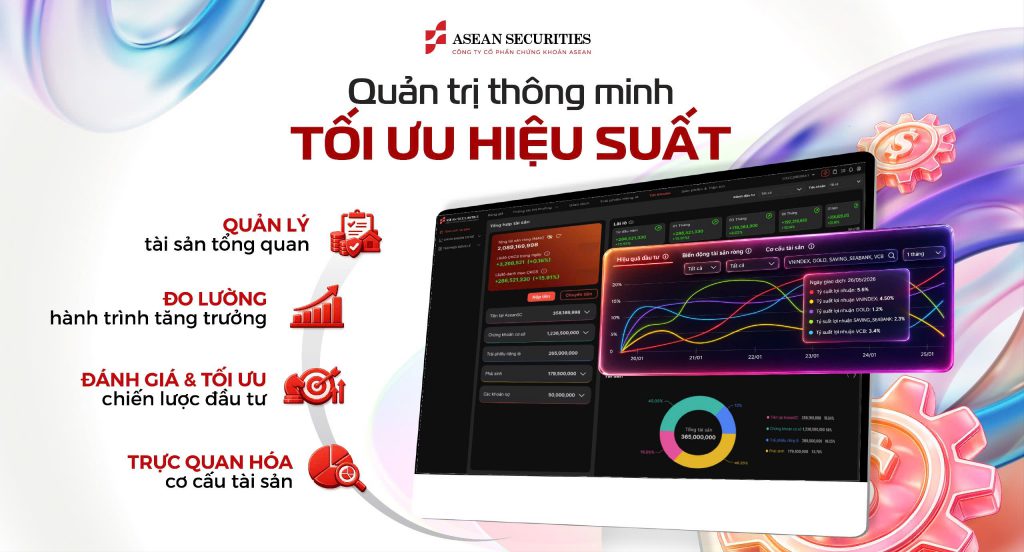
Recognizing these challenges, ASEAN Securities (ASEANSC) has officially launched a new Asset Management feature on its Webtrading platform and SeaStock app. As part of the company's evolution toward a comprehensive Wealthtech model, this new feature enables investors to oversee their total assets, track growth, and evaluate investment performance—all within a single, unified platform.
Asset Management Overview
Right on the Overview screen, investors can easily track their total net assets along with the detailed value of each asset class—including cash, underlying securities, private placement bonds, and liabilities—broken down by sub-account.

Notably, the feature simultaneously displays intraday profit/loss (relative to the reference price) and portfolio profit/loss (relative to the cost basis), enabling investors to clearly visualize daily asset fluctuations and the portfolio's actual performance.

Visualizing asset allocation

Investors can easily grasp capital allocation weightings and effectively manage leverage through charts:
- Asset composition: Shows the proportion of each asset class relative to total assets, enabling investors to easily identify capital allocation and portfolio concentration.
- Leverage ratio (margin): Displays the ratio of debt to current Net Asset Value (NAV), helping investors monitor leverage usage and proactively manage risk.
Measuring the Growth Journey

Investment performance is not evaluated at a single point in time; investors can review the entire journey of asset fluctuations and growth across various cycles: 1 month, 3 months, 6 months, 1 year, and year-to-date.

Profit/Loss Statistics by Period: Track investment performance across multiple timeframes to assess portfolio growth in the short, medium, and long term.
Net Asset Value (NAV) Fluctuations: Monitor changes in NAV, Total Assets, and Liabilities over time, helping investors better understand their asset growth journey.
Asset Composition: Observe changes in asset class weightings over time to identify how the portfolio has shifted and how capital has been allocated across different periods.

This enables investors to gain a comprehensive view of asset growth over time, establishing a solid foundation for optimizing future strategies.
Evaluate & Optimize Investment Strategies

A key highlight of this feature is its ability to help investors evaluate portfolio performance within the broader market context.

It provides charts that directly compare investment performance at ASEANSC against other market options—such as the VN-Index, gold prices, savings deposits, and individual stocks—across various timeframes: 1 month, 3 months, 6 months, 1 year, and year-to-date.

This allows investors not only to track whether their portfolio is profitable or incurring a loss but also to benchmark their returns against other market alternatives. Armed with these visual insights and comparative data, investors can proactively adjust their asset allocation and investment strategies to align with their goals.

Experience the new Asset Management feature on SeaStock today! Let ASEANSC accompany you on your journey toward sustainable wealth management and growth.